


TL;DR
Run load #prof in your local PICO-8 console, then edit the last tab with some code you want to measure:
prof{
  locals={9},         -- args to pass each function (optional)
  function(x)
    local _=sqrt(x)   -- code snippet 1
  end,
  function(x)
    local _=x^0.5     -- code snippet 2
  end,
} |
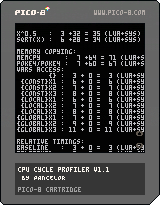
Run the cart: it will tell you exactly how many cycles it takes to run each code snippet.
OVERVIEW
This tool measures precisely how many cycles it takes to run arbitrary snippets of code. I use it all the time when I'm trying to figure out the fastest way to write an algorithm. For example, it's massively helpful to know the fastest way to calculate abs(x) in a modular synthesizer that needs to run this operation tens of thousands of times per second.
For context, PICO-8 runs at 8 million cycles per second. This number is unimaginably large and yet also hundreds of times slower than most desktop computers. To keep things in perspective, I like to remember that 1400 cycles is equal to 1% of your CPU budget each frame (at 60 fps -- 8*1024*1024/60/100 = 1398.1)
The wiki lists cycle costs for individual operations, but I often prefer to directly compare two larger snippets of code against each other, so I built this cycle-counting tool. Plus, the wiki can get out of date but this tool will always remain accurate, since it actively measures speed instead of looking it up.
For the curious, here's how I'm able to mesaure exact cycle counts. Essentially, I run your code many times and compare it against running nothing many times, using stat(1) and stat(2) for timing:
USAGE GUIDE
Run load #prof in the PICO-8 console, then edit the last tab.
The cart comes with detailed instructions, reproduced here for your convenience:
There are also instructions included on two alternate ways you can profile your code, without using prof:
DEMO
Here's an old demo program to wow you:

This is neat but impractical; for everyday usage, you'll want to load #prof and edit the last tab.
SOME RESULTS
Here are some speed comparisons I found interesting:
CREDITS
prof tool by pancelor.
Thanks to @samhocevar for the initial snippet that I used as a basis for this profiler!
Thanks to @freds72 and @luchak for discussing an earlier version of this with me!
Thanks to thisismypassword for updating the wiki's CPU page!
CHANGELOG

the profiler is missing an input variable somehow - the current pattern forces declaration of a local (or global) to mimic real life usage
qol request: copy results to clipboard
good points -- added! passing input variables is slightly awkward, but it's at least possible now
I've updated the description + cart (load #prof) to be a lot clearer
update! I reworked the interface a bit, added an option for comparison against a baseline function, and some other stuff (see the v1.5 changelog for more details)
prof{
  baseline=function()
    local tab={"a","b","c"}
  end,
  function(x)
    local tab={"a","b","c"} --this line's cost will be skipped
    deli(tab, 2)
  end,
  function(x)
    local tab={"a","b","c"} --this line's cost will be skipped
    del(tab, "b")
  end,
} |
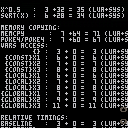
Also, the results now show in a table, like this:
 total |  lua  |  sys  || result
-------+-------+-------||-------
    33 |     5 |    28 || 3
34 | 2 | 32 || 3 |
[Please log in to post a comment]