


Here's a little profiler you can drop into an existing program - if you have 313 tokens to spare.
It instruments the global functions to count the number of calls and measure the CPU time spent inside them. Then it dumps it to a CSV file you can open in a spreadsheet viewer, and hopefully get some insight into where your program is spending the most time.
Instructions are in the comments at the top.
EDIT:
- Count fn calls in a single 32bit integer (thanks @freds72).
- Use "..." arguments syntax to support more than 9 arguments (thanks @Siapran)
- Save uninstrumented fns to avoid calling the instrumented ones when dumping stats.
-->8
-- profiler

-- usage:
-- run your program
-- press esc to break
-- > _prof.begin()
-- > resume
-- run your program some more (to gather data)
-- press esc to break
-- > _prof.dump()
-- this will dump a profile.csv file to the cart's folder

-- notes:
-- profiling for more than 2-3 minutes could cause cpu measurements
-- to overflow, and give incorrect results.
-- measures the amount of cpu spent in each function, where 1 is one whole frame
-- so divide by frame rate to get seconds (30, or 60 if using _update60).
-- profiling will slow down your program somewhat.

_prof={
	stats={},
	-- list of global functions to *not* instrument
	donttouch={flip=true,__flip=true,_startframe=true,_update_buttons=true,_get_menu_item_selected=true,_update_framerate=true,_map_display=true,_mark_cpu=true},
	-- original uninstrumented functions
	type=type,
	stat=stat,
	printh=printh,
	all=all,
	tostr=tostr,
	pairs=pairs
}

-- start profiling.
-- if called multiple times, will reset stats
_prof.begin=function()
	-- clear stats
	_prof.stats={}

	-- instrument functions
	if not _prof.instr then
		for n,v in _prof.pairs(_ENV) do
			if _prof.type(v)=="function" and not _prof.donttouch[n] then
				-- wrap function
				_ENV[n]=function(...)
					-- run and get cpu timing
					local cpuin=_prof.stat(1)
					return (function(...)
						-- update stats
						local cpuout=_prof.stat(1)
						local st=_prof.stats[n] or {ct=0,cpu=0}
						st.ct+=0x0.0001
						st.cpu+=cpuout-cpuin
						_prof.stats[n]=st
						return ...
					end)(v(...))
				end
			end
		end
		_prof.instr=true
	end
end

-- dump profile stats to file
-- order is field to order by (name,ct,cpu,avg)
-- defaults to "cpu"
-- dst is printh destination
-- defaults to "profile.csv"
_prof.dump=function(order,dst)
	order = order or "cpu"
	dst = dst or "profile.csv"
	local rpt={}
 	for n,v in _prof.pairs(_prof.stats) do
		local cpu,ct,sh=v.cpu,v.ct,16

		-- average is cpu/(ct<<16), except that ct<<16 could
		-- overflow, in which case shift ct left as many bits
		-- as possible and shift cpu right the remaining bits.
		while sh>0 and ct<0x4000 do		-- can't exceed 0x7fff as it would be treated as negative
			ct<<=1 sh-=1
		end
		cpu>>=sh

		-- create stat
		local st={name=n,ct=v.ct,cpu=v.cpu,avg=cpu/ct}

		-- insert into rpt in order
  		local i=#rpt+1
  		while i>1 and (rpt[i-1][order]>st[order])==(order=="name") do
  			rpt[i]=rpt[i-1]
  			i-=1
  		end
	  	rpt[i]=st
	end

	-- print rpt
	_prof.printh("name,ct,cpu,avg",dst,true)
	for st in _prof.all(rpt) do
		_prof.printh(st.name..",".._prof.tostr(st.ct,2)..","..st.cpu..","..st.avg,dst)
	end
end |
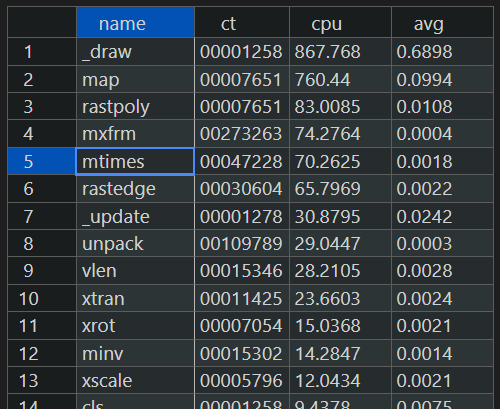
Here's an example of my 2D transforms demo.
For example you can see it spends a large amount of time in the "map" function (which would normally be suspicious except that the "2D transforms" replaces the standard "map" function with a custom version).

suggest to use increment of 0x0.0001 to count function calls - would remove the need to handle overflows, use tostring(ct,2) to get full 32bits value
afk but would that work with less tokens:
— correction: doesn’t work 😰
_𝘦𝘯𝘷[n]=function(...)

  -- run and get cpu timing
  local cpuin=stat(1)
	return v(...),(function(cpuout)
	  -- update stats
	  if (not _prof.stats[n]) _prof.stats[n]={ct={0,0},cpu=0}
	  local st=_prof.stats[n]
	  st.ct+=0x0.0001
	  st.cpu+=cpuout-cpuin
	end)(stat(1))
end
|
to make it work with multiple return values:
_𝘦𝘯𝘷[n]=function(...)

  -- run and get cpu timing
  local cpuin=stat(1)
  return (function(...)
      -- update stats
      local cpuout = stat(1)
      if (not _prof.stats[n]) _prof.stats[n]={ct={0,0},cpu=0}
      local st=_prof.stats[n]
      st.ct+=0x0.0001
      st.cpu+=cpuout-cpuin
      return ...
    end)(v(...))
end |

@Mot, Awesome tool and perfect timing, since I'm currently working on performance for a 64x128 32 colors pico-8 draw library.
@Siapran, interesting, do you know a good resource for me to learn how to use triple dot ?
This could be very useful for Wpal() that is the 32 colors equivalent to pal(), but only supports single palette entry change at the moment.
@RealShadowCaster, ... represents a variable number of arguments (0 or more):
function foo(value, ...) -- must be the last position in the parameter list
  local a1, a2, a3 = ... -- in a function body, ... evaluates to 0 or more values
  local args = {...} -- you can package them into a table, like you can with any list of values
  print(a1)
  print(a2)
  print(a3)
  print(#args)
end

foo(1, 2, 3, 4, 5) -- prints 2 3 4 4
foo(1) -- prints nil nil nil 0
foo() -- prints nil nil nil 0
foo(1, 2, 3) -- prints 2 3 nil 2 |
... is very useful for generic programming like that profiler above, where we manipulate different functions.

It's worth noting that sometimes t=pack(...) is better than t={...}, as it allows you to detect the difference between trailing nil arguments vs. nothing being passed, since pack() adds a t.n member with the actual count of ..., whereas trailing nils are ignored when querying #t:
> t=pack(1,2,3,nil,nil) > ?#t 3 > ?t.n 5 |
Similarly, using unpack(t) will produce a 5-tuple with two nils on the end, because it checks for the t.n value and pads the tuple with nils. This matters when you're storing deferred function calls, especially API function calls, since there are several that care about the difference between an explicit nil arg and one that isn't supplied.
This is sometimes useful, though not always, and pack() does cost an extra token and a little call overhead, so use it judiciously.
[Please log in to post a comment]