


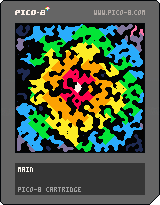
Dijkstra Map visualizer

While trying to follow a talk on map generation on youtube I created some demos. Here is one that is most functional and most pretty so far.
Controls:
- Arrows: move the cursor
- Z: Calculate a new map starting from the cursor
- X: Generate new cave
Explanation:
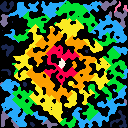
Dijkstra maps contain information about distance from each point on the graph to a set starting point. In this case the graph is a generated cave-like map and the point is picked at random, but can be changed with arrow keys + Z.
After the Dijkstra map is calculated the cave map is colored like this:
- Walls are black.
- Inaccessible areas are dark blue.
- Accessible area is colored based on the distance, changing color every 20 pixels. It also shifts the colors as time progresses.
If you would like to see more demos like this leave a comment and I may add some more to this post.
3
[Please log in to post a comment]