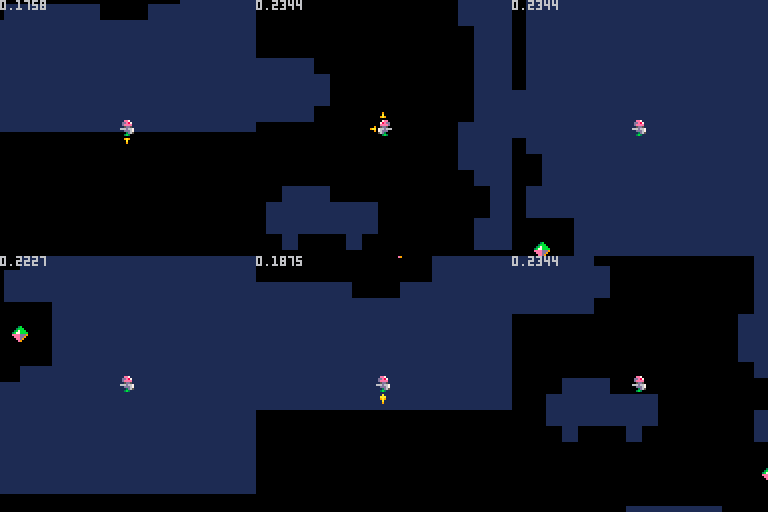
I noticed that if I have a 64x64 map (the bottom 32 rows use the shared sprite/map area), Pico-8 seems to slow down when I draw the map with the shared area visible. I even tried to draw a constant 16x16 tile area (instead of drawing the full map and let clipping handle the rest as usual).
So my question is that is it really a feature that accessing the shared data is slower and if so, why doesn't that affect whatever number stat(1) returns?

Hey kometbomb
It should be the same. Are you sure there isn't some co-varying hidden variable? (e.g. some expensive world object lurking around the bottom of the map). I tried to isolate this, but couldn't reproduce it yet.
To clarify -- do you mean that stat(1) returns the same, but pico-8 uses more cpu on the host machine?

I will double check but I was quite sure the issue was related to where on the map the visible area is compared to number of tiles drawn or if there is something else visible.
stat(1) returns a constant 0.22... or less but the screen update gets choppy. There is no visible difference in the stat(1) value before or after the point I see the slowdown. Host CPU use is a constant 5 %.

Stab in the dark -- does it also happen if you view the far right of the map? I wasn't clipping which cels are tested and drawn which is a bit inefficient; the whole map was being clipped as sprites one by one instead. But I wouldn't have guessed it could cause visible slow-down, especially on a modern desktop computer.
While looking at the map drawing code I also found that empty cels were costing as much (virtual pico-8) cpu as ones with sprites in them. Bonus!

Yeah, it's the far right-bottom that triggers it but I was pretty sure that my code draws the map so that it always draws just the 16x16 visible area. I.e. something like:
map(flr(cameraX / 8), flr(cameraY / 8), -cameraX % 8, -cameraY % 8, 16, 16)
Will check it right now.

Results:
I wrote a test program that just draws the map and it doesn't get jerky. But the original game I had that issue does that (check the gif, it is visble when the guy gets almost outside the 64x64 map, lower right corner). You can see the stat(1) output doesn't chance and it well below 100 %.

In the game I disabled all collision etc. code so it should not be that, and that indeed all expensive logic should be visible in the CPU counter, right?
EDIT: I noticed at least Firefox has trouble playing the gif with a stable rate, it works better if you drag it in its own tab.

OK, turns out I was barking at the wrong tree. I can now see the stat(1) counter go up (I think it sometimes is not very accurate and might show over 100 % use with no slowdown and vice versa). So it must be something in my code. Sorry for keeping you in suspense. ;)
I will open up a new issue if I notice anything suspicious.
[Please log in to post a comment]


