


Hi all!
Based on my embryonic understanding of polar coordinates, you can draw a spiral by incrementing R and THETA in lock step.
So I put together this little blob of code:
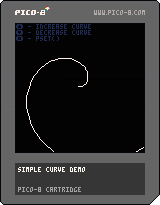
-- draw a spiral -- in polar coordinates, you -- do this by incrementing r -- and theta at the same time. for r = 1,99 do theta = r / 100 x = r * cos(theta) y = r * sin(theta) pset(x,y) end |
And that almost yields a spiral! At least it yields a curve. Yay curves!
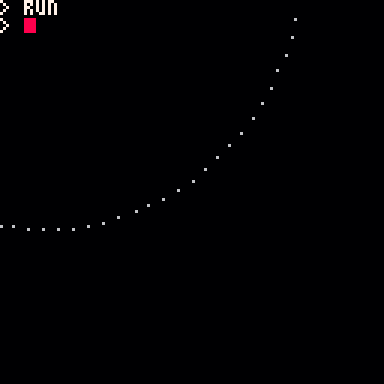
Is it possible that I'm drawing my spiral, I just need to somehow scale it down so that the dots are contiguous and maybe the angle of turn is sharper?
Any clues are appreciated. I'm just trying to gain an understanding of the basics and build from there.
Thanks!

The reason that only a curve instead of a spiral is that Pico-8 coordinates (or screen drawing coordinates in general) aren't like regular mathematical coordinates. Instead of the origin being in the center, the origin is at the top left corner of the screen. Also, positive values go down on the y axis instead of up. (The curve still shows up normally because the Pico-8 sin() function is flipped too for convenience's sake.)
In order to make the dots contiguous, use the line() function instead of the pset() function. In the newest version of Pico-8, lines that don't have a second set of coordinates as parameters automatically connect to the previously drawn line. That way, you don't have to go faffing about storing the end of the previous line.
Here's a simple demo showing off this stuff for ya. Have fun with Pico-8!

@Actually_Ed that did help a LOT thank you very much! I'm much closer now!
Here's what I have:
-- draw a spiral
-- in polar coordinates, you
-- do this by incrementing r
-- and theta at the same time.

theta=0.05
for r = 1,99 do
    -- theta = r / 100
    theta = theta + 0.05
    x = r * cos(theta)
    y = r * sin(-theta)

    line(x+50,y+50)
end |
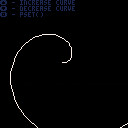
Which yields the following image:
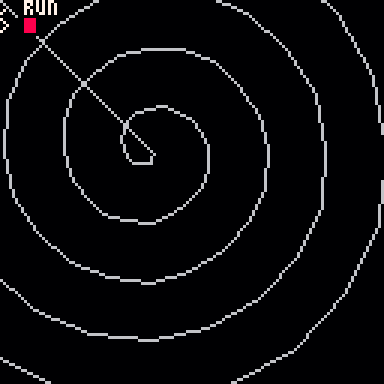
The only mystery left now is why I get that odd line going back to origin. I tried inserting a bounding check to ensure x and 7 don't get larger than 127 but that had no effect.
Thanks so much for helping me out with learning to crawl :)
@feoh The reason for that strange line is because calling the line() function with one set of coordinates instead of two makes it so the starting point of that line is the end point of the previously drawn one. But since there's no line that was drawn before the first one, it defaults to using (0,0). You could either do what I did and draw a single invisible line for where you want the previous end point to be, or you could do it the old fashioned way and manually store the last endpoint.
Glad I was able to help! :)
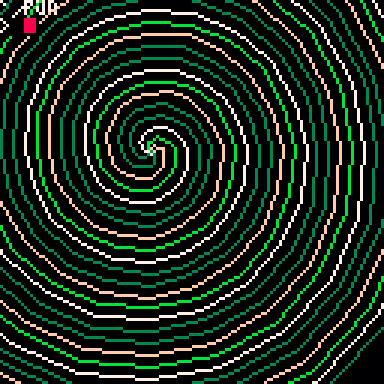
Success!
-- draw a spiral
-- in polar coordinates, you
-- do this by incrementing r
-- and theta at the same time.

function draw_spiral(start_theta, colr)
	theta=start_theta
	line(50,50,51,51)
	for r = 1,99 do
	    -- theta = r / 100
	    theta = theta + 0.05
	    x = r * cos(theta)
	    y = r * sin(-theta)
            color(colr)
	    line(x+50,y+50)
	end
end

for tloop=0,1,.20 do
  colr = (tloop * 100) % 16
  draw_spiral(tloop, colr)
end
|
Which yields:
[Please log in to post a comment]