


Newbie amateur game dev here! I've been programming for a few years now, mostly for academic/scientific purposes. I've always wanted to try my hand at making games, but I've always found an excuse not to.
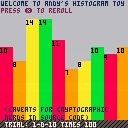
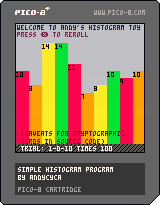
So screw that, I'm starting from zero in a new language doing the absolute minimum that I can call a "thing" and here it is: a very simple histogram tool that "rolls" virtual dice and displays the frequency of the different rolls (excluding events with zero-frequency).
I'm used to doing this with more sophisticated tools and ad-hoc libraries, learning to do things «by hand» is a challenge in and of itself.
The histograms do not generally follow the distribution that one would expect. I believe this happens because:
- Strong cryptographic principles and robust (pseudo-)random number generation is outside the scope of a tool like Pico-8, and
- Andy has screwed something in the code and prefers to publish something imperfect rather than trying to perfect it and never publish it.
So here it is, a small tool that will expose me and might help someone in the future.
Customization
Ideally, you should only need to customize three things:
rollsis how many times you will try the experiment; in a real-life situation you want this to be largedpris how many dice you're rolling each time. It's the first number in the common dice notation (1d8)dsis the dice size, or how many faces the virtual dice have. Common dice for D&D are obviously 4, 6, 8, 10, 12, and 20; but one can customize it to other numbers for «impossible» dice.
What else?
I haven't tested this with larger numbers, mostly because P8 is not the tool for such rigorous analysis and data visualization. Use large numbers at your peril.


tl;dr: The code has two minor issues. I did statistics to the 1d10 histogram, and I didn't find anything wrong with the distribution.
I skimmed your code and it looks mostly correct to me. I only saw two issues related to randomness generation:
die(n)usually returns 1 to n, but it can rarely return 0 as well. This is because it calculates its output asceil(rnd(n)), and if rnd outputs zero exactly (which is possible, see the manual), then ceil will also output zero. To avoid this, a safer way to calculate a die roll isflr(rnd(n))+1.-
In the
trial()function, each dice roll is written to the output table twice, once by line 97 and again by line 98:results[i] = rollsum add(results, rollsum)
If you roll 1, 2, and 3, then
resultswill look like{1,1},{1,2,2}, and{1,2,3,3}. The net effect is that the last die roll occurs twice in the output.
Even with the above issues, the frequency distributions look roughly correct to me. Rolling a 1d10 with rolls set to 2499 (outputs a total of 2500 values because of the previously-mentioned duplication issue), I got the following data:
{244, 241, 260, 274, 255, 247, 228, 221, 248, 282} |
We expect each of those bars in the histogram to be 250. None of them are 250 exactly. So the question is, how far off are we? Is there something broken with the generator code? Is PICO-8's built-in RNG simply not up to snuff?
We can do a chi-squared test to find out.
(244-250)^2/250 + (241-250)^2/250 + (260-250)^2/250 + ... + (282-250)^2/250 = 12.72 |
The above number is a measure of how "incorrect" the distribution is. If every bar of the histogram was 250 exactly, then that number would be 0. But if the histogram departs from that platonic ideal, then that number will go up. And if that number is huge, that's evidence that our random numbers are not uniformly random.
And as it turns out, 12.72 is actually not that big. For 9 degrees of freedom (10 sides on the die, minus 1... it's kind of hard to explain), here's what the chi-squared distribution looks like:
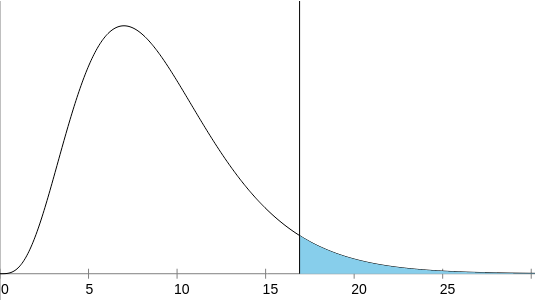
Assuming perfectly random dice, most of the chi-squared values will fall into the white region on the left (95% of the area under the curve). But if the dice are badly biased, the chi-squared value will fall into the blue region on the right (5% of the area under the curve). The dividing line is at 16.92, and our value (12.72) is less than that -- it falls into the "looks normal enough" region.
Technically, this does not prove that the cart is doing a perfect job of generating random numbers. In fact, we know there are some minor issues with the numbers (the two bullet points from earlier)! But any issues with the randomness are minor enough that the chi-squared test was unable to detect them. In other words, PICO-8's rnd is probably random enough. @andycyca's code is probably correct enough. The reason the histograms don't look perfect is that's just what random numbers look like!
Hi! First of all, thank you @cmounce for the detailed reply. I'll be replying as I go through it.
- Random distribution: You're right, I somehow missed the case when it outputs 0 exactly. I blame this on my previous programming experience.
- Regarding
trial(n), I believe this was the result of me trying to achieve the same result in various ways and for some reason I failed to comment one of the two options. In my line of work I tend to initialize arrays with zeroes and then update the values as I go, but I wasn't sure if I could achieve this easily, hence the two approaches. - Regarding the statistical test: you had me going back to some of my books! I don't know why I didn't think to test it before.
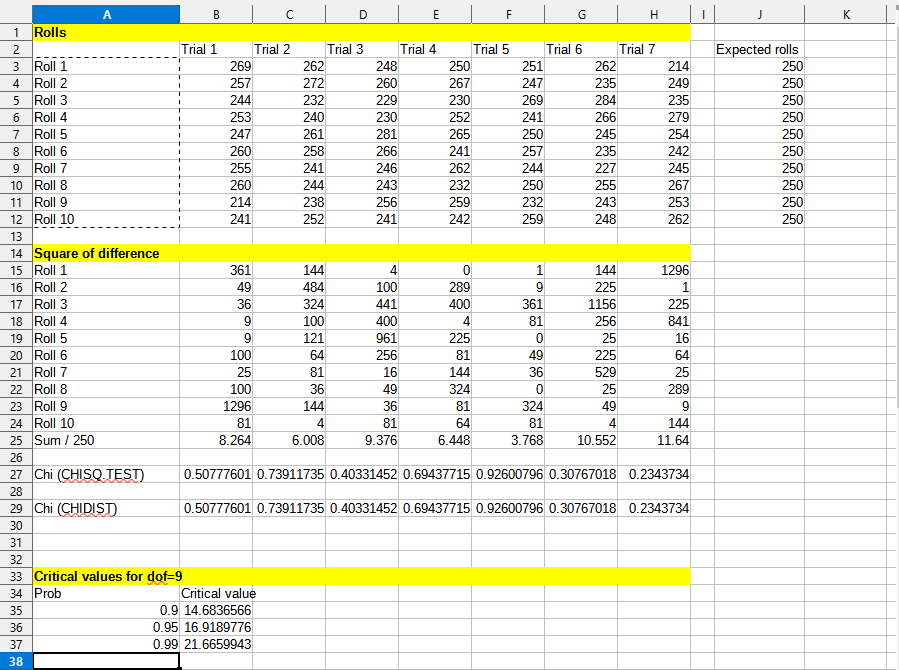
I ran some tests with results below. Indeed, none of the 7 trials seems to be very biased (even with a significance value of p=0.9) so yes: the tools are random enough for low-level applications, which is fine by me: I'm using this to program games and not for strong statistical analysis :)
I'll update the toy to make some more changes and see where I can take it. Thank you so much for your input!
[Please log in to post a comment]